Annual Impact Report 2025/2026

This year, we’ve continued gathering feedback from the very people our workshops are designed to support… students. Through the QR codes on our You Pads that link to our feedback survey, we’ve captured invaluable insights that drive our continuous improvement.
Don’t have time to read this now? Download a PDF copy.
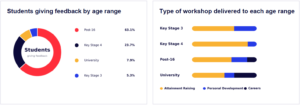
Here’s a breakdown of which workshops were delivered to which age groups:

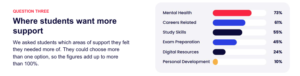
Our feedback forms aim to gather four pieces of information:
To find the answer to the first question, we ask a series of YES/NO questions that are phrased as such: “do you now understand…” and “did this workshop…”
We then exported all of the submissions and used tools such as Excel and Yabble to analyse them.
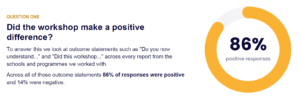
The chart below illustrates the percentage of positive answers (yes) vs. the percentage of negative answers (no), based on the responses from 9,324 students.
The methodology we used to determine popular ideas and techniques we teach is highlighted below. As you can see, the overall most popular terms were:

SPOTLIGHT: Winchester University Academic Coaching and Transition Programme
Now in its second year, this programme tracked the same 114 year 6 pupils across three primary schools before and after their sessions. This gives us a genuine picture rather than a single snapshot.
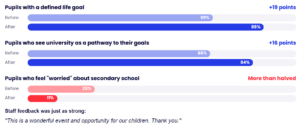
As this data shows, the reception of our workshops across a wide range of ages was overwhelmingly positive. This, however, doesn’t mean our work is finished. We continuously monitor and analyse the feedback we receive in order to improve our workshops and maintain our position as the UK’s number one enrichment provider.
To learn how we can support your school, college, or university, contact us today.
 Back To News





A fantastic way for students to consolidate the ideas and techniques they were introduced to during a live workshop.
Learn more